feat: add resource health dashboard, by Yu-Jack. Reviewed at dc84fe7 on 2026-11-04, round 1. Nothing is posted on GitHub.
Verdict: request changes
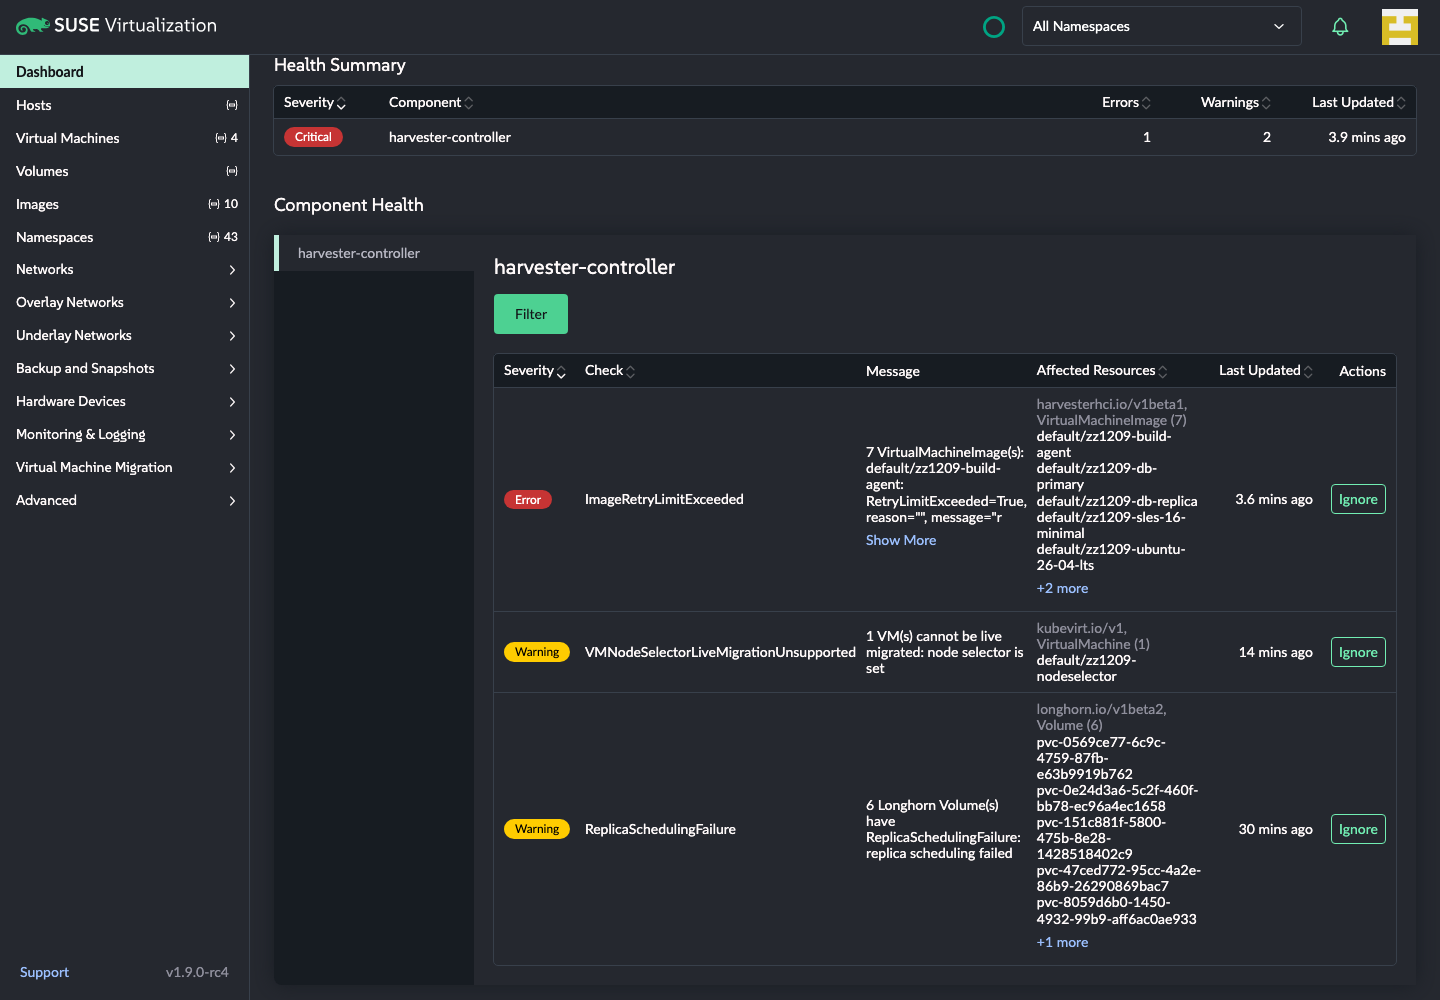
The read side works well. Real controller data renders correctly, sort and filter work, and live updates arrive in about 3s without a reload.
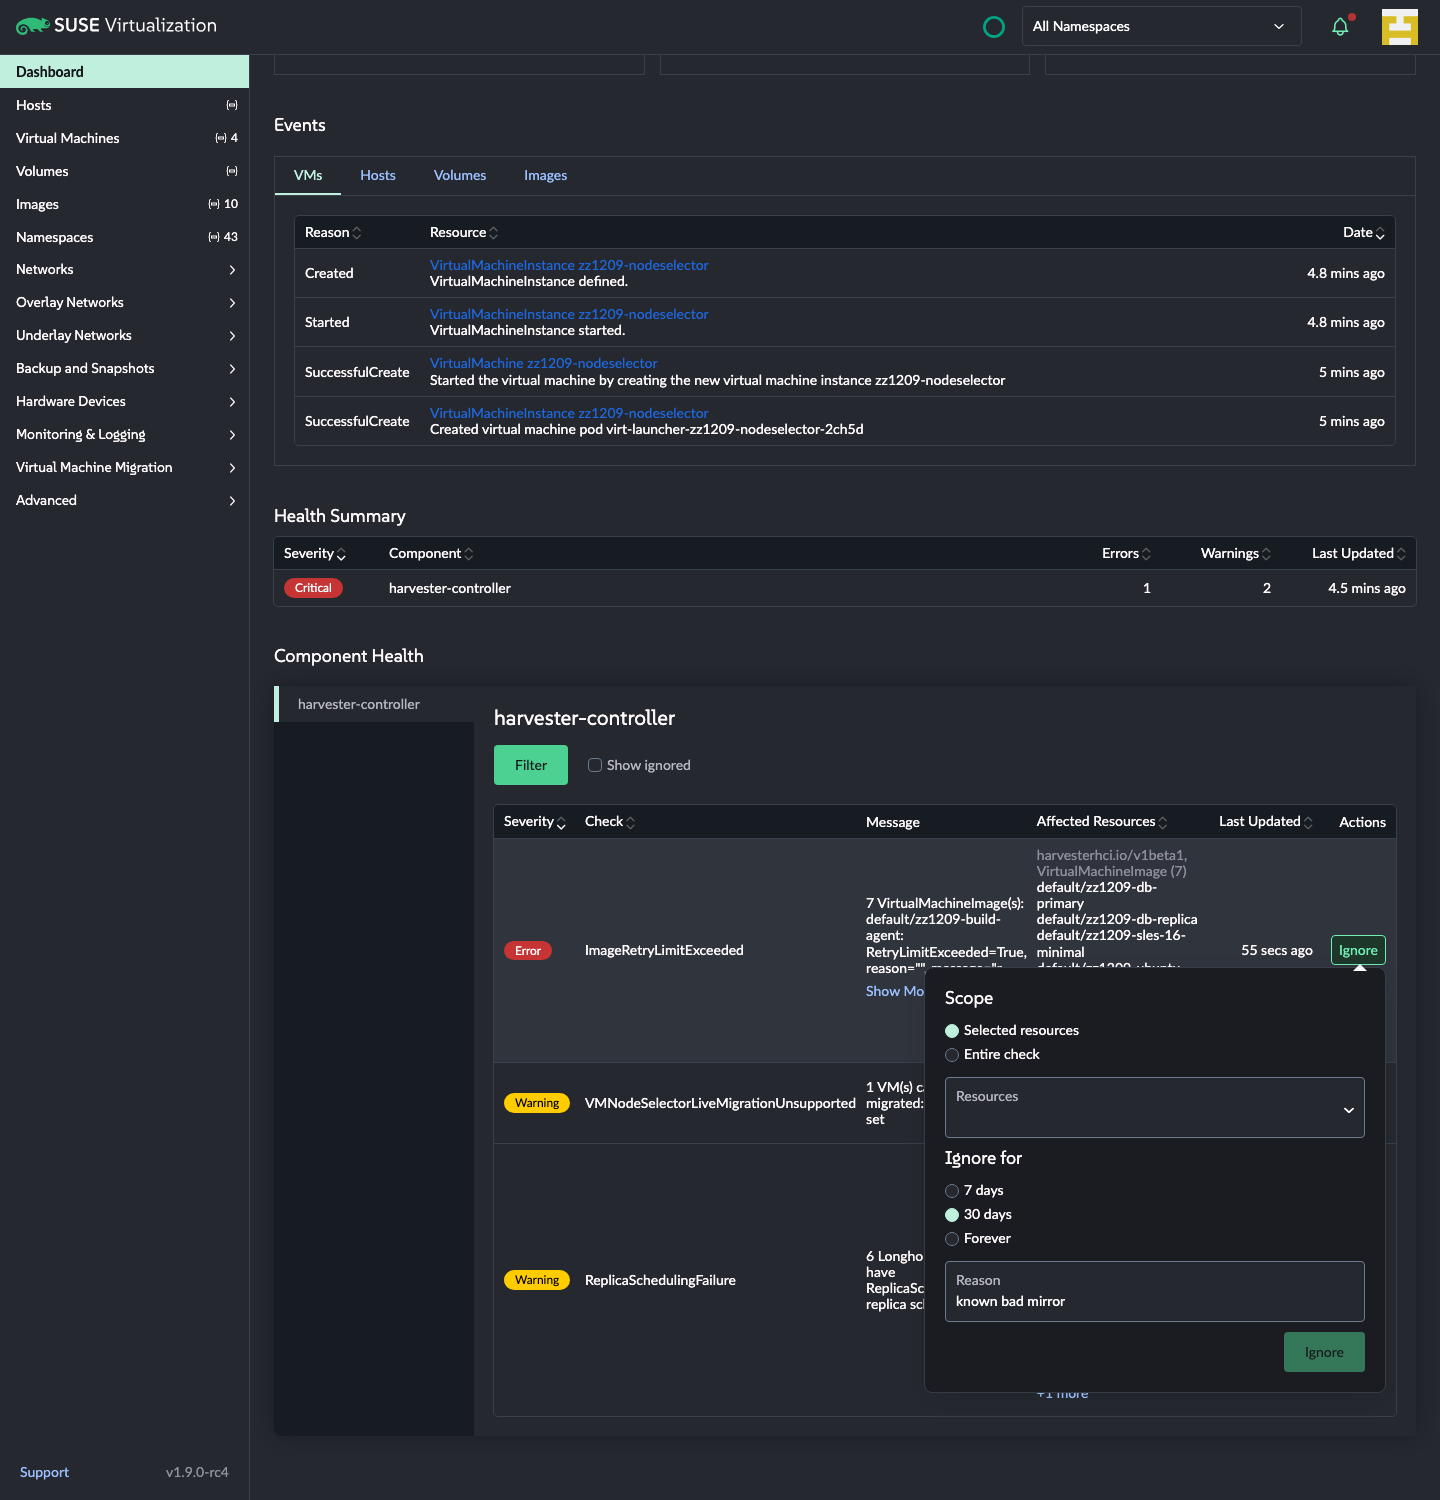
The write side is where it breaks. Restore does too much on a resource (1) and too little on a check (2), and the Ignore popup keeps stale state (3) and hides its own button (4).
Layout: at 1280px the Ignore button is off-screen (5). Copilot's permission notes are also still open (6).
Risk is contained, which affects how hard to push: it is gated on v1.10.0 and the addon ships disabled and marked experimental. Findings 1–4 mislead users about what is ignored or block the action, so I'd fix those first. The rest could be follow-ups.
Who fixes it? Yu-Jack wrote on 11-03 that they will be away for the next few weeks, and moved the issue to ready-for-test before this merged. The v1.10 RC dates are already running, so this needs a decision from you and Vicente-Cheng.
Test it yourself
The preview is built from dc84fe7 with VUE_APP_SERVER_VERSION=v1.10.0, against .118 (admin password in .env). The real controller and my fixtures stay installed until you say to remove them: 7 failing zz1209-* images and a running VM zz1209-nodeselector. No ignore rules are left, so you start clean.
Open the Dashboard link above and scroll to Component Health at the bottom.
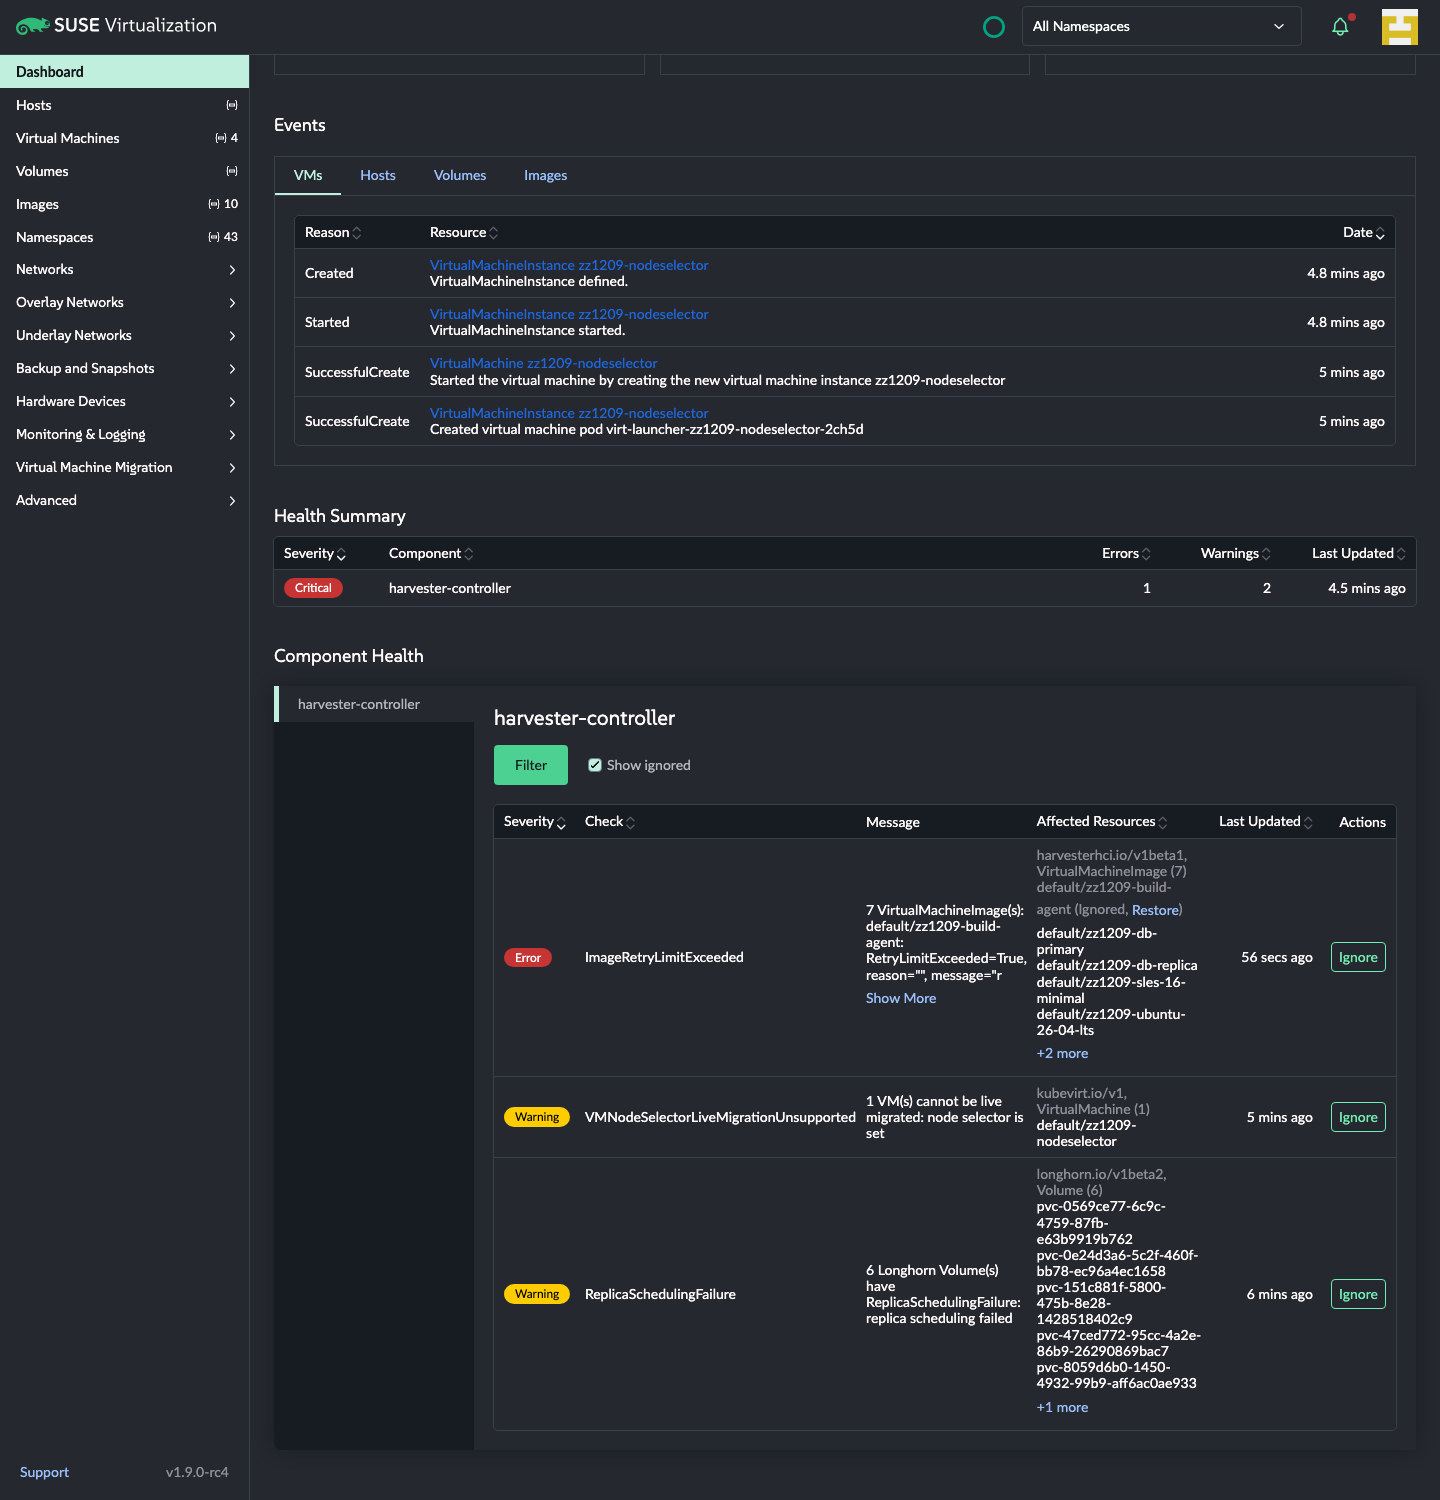
Ignore 3 of the 7 images on ImageRetryLimitExceeded, tick Show ignored, then Restore just one of them (finding 1).
Open Ignore on that row again and look at what it preselects (finding 3).
Make the window narrower than 1400px (finding 5).
Walkthrough
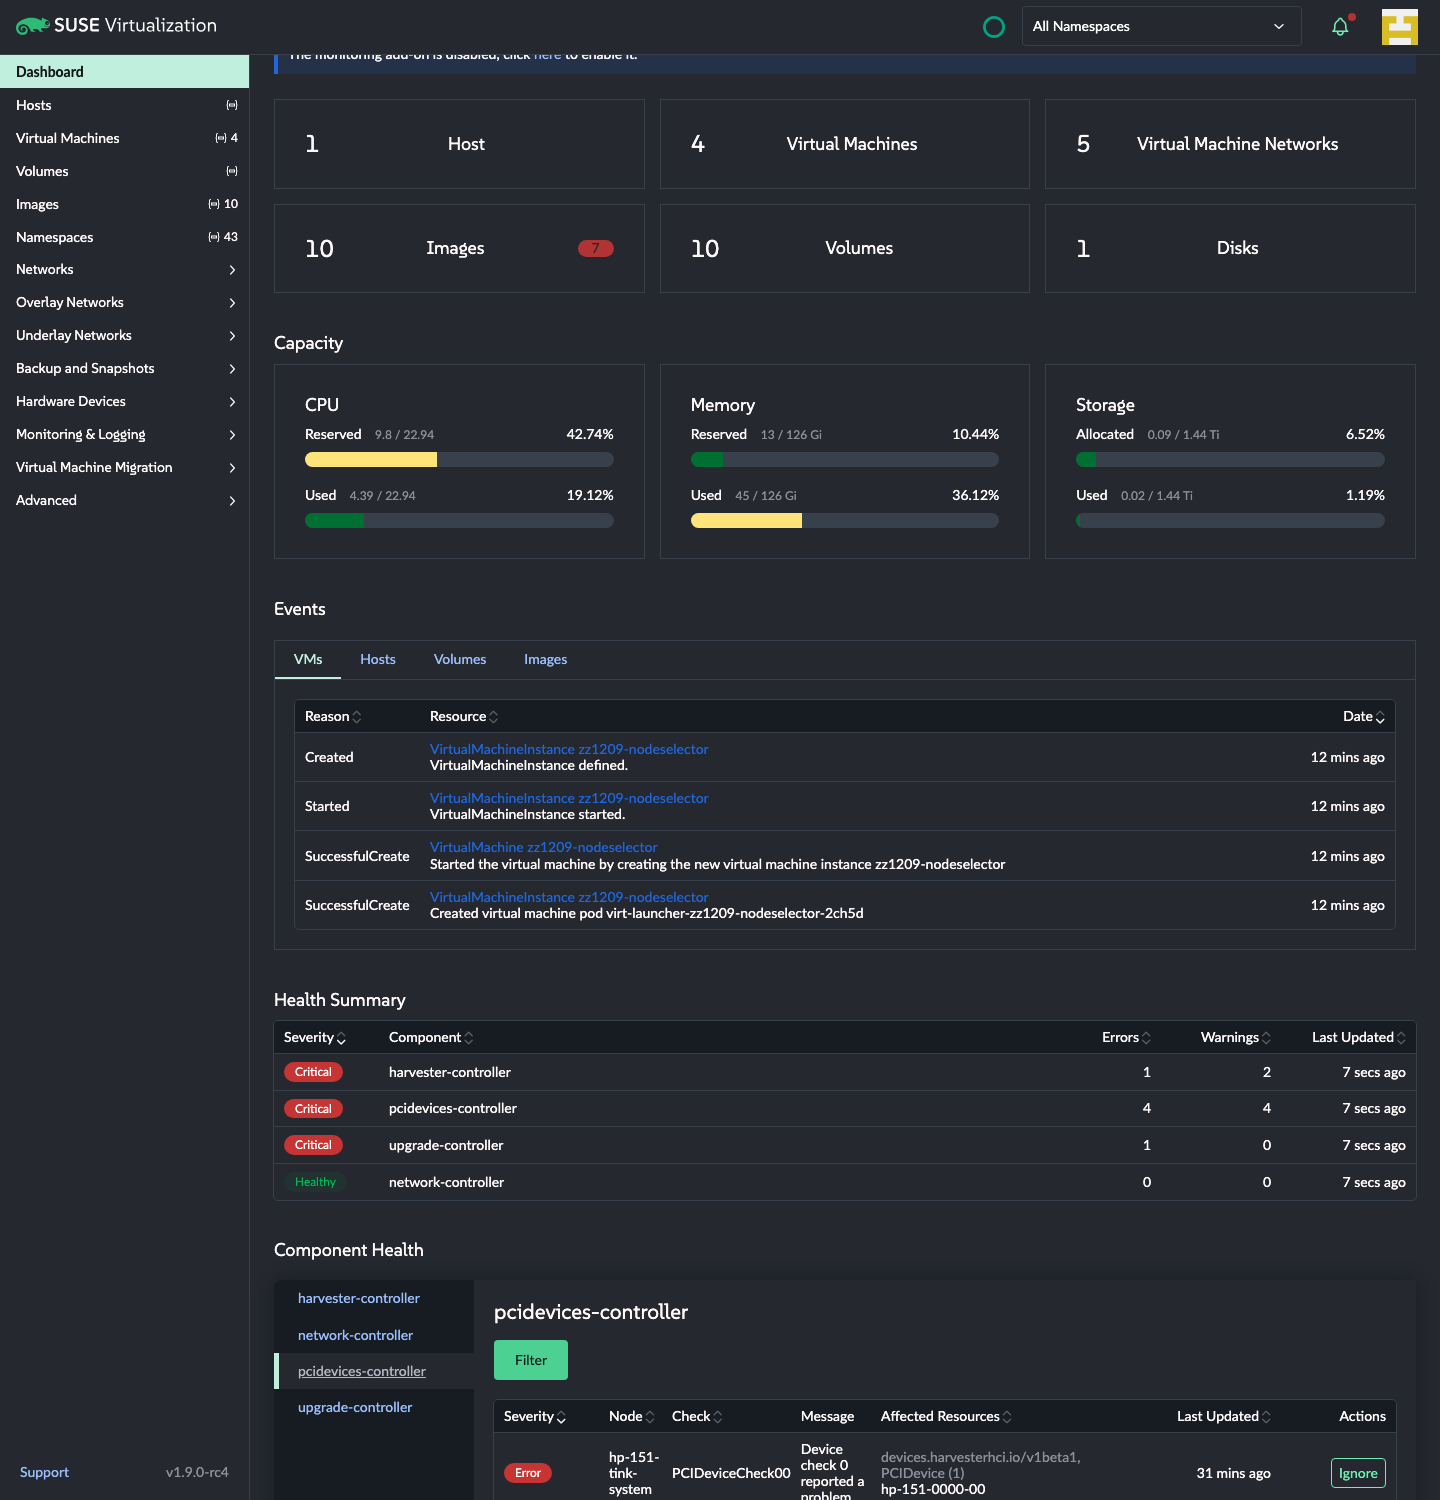
Real controller data. Summary, messages, resource lists and the filter.
Findings
1
One Restore click on a resource restores every resource in that rule
Each ignored resource has its own Restore link, but the link deletes the whole HealthIgnoreRule. The default way to ignore puts all selected resources in one rule, so this case is the normal one. I clicked Restore on db-primary; db-replica and sles-16-minimal came back too (DELETE on the rule, then 204). The HEP does say Restore deletes the rule, but it describes the action on "an ignored check or resource", and nothing in the UI warns about this.
Suggested comment
Restore on a single resource deletes the whole rule, so if the rule lists three resources all three come back. I would expect only the one I clicked. Could it update the rule to drop that resource, and delete the rule only when it was the last one?
2
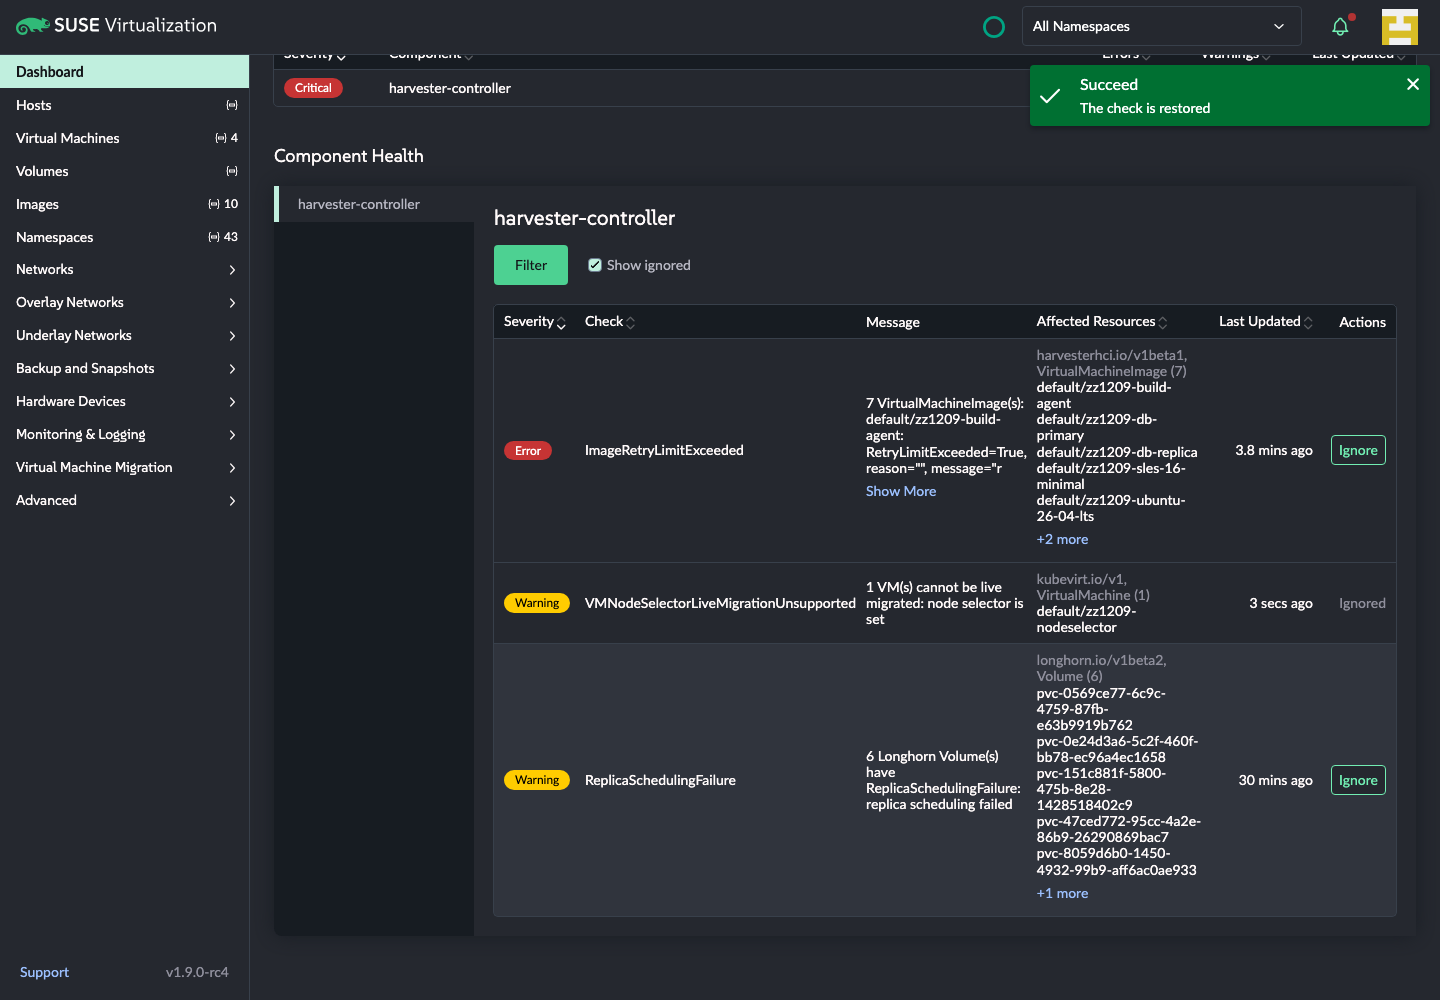
The row Restore only undoes one rule, but says the check is restored
The opposite of finding 1. When several rules together cover every resource, the controller marks the check as ignored and ignoredBy names only the first rule. The row Restore deletes that one. With 3 rules over 7 images, the check came back with 4 images still ignored, the growl said "The check is restored", and the row went back to an Ignore button.
Suggested comment
When several rules cover a check, the row Restore only deletes the rule in ignoredBy. With three rules over 7 images, 4 stay ignored after "The check is restored". It should delete every rule that applies to the check.
3
The Ignore popup keeps its old state after a successful save
selected, duration and reason are never reset. After ignoring 1 of 7 and reopening on the same row: Resources is empty (the HEP says the default is all selected), 30 days is still set, the old reason is still filled in, and Ignore is disabled. It also goes wrong silently: after a Restore, the popup opened with my previous 3 resources preselected rather than all of them, and I created a rule I didn't mean to during testing.
Reopened on the same row: empty Resources, old reason, Ignore disabled
Suggested comment
The popup keeps its state after saving. Reopening it on the same row gives an empty Resources field, the previous reason and duration, and a disabled Ignore button. Could it reset on success so it always opens on the defaults?
4
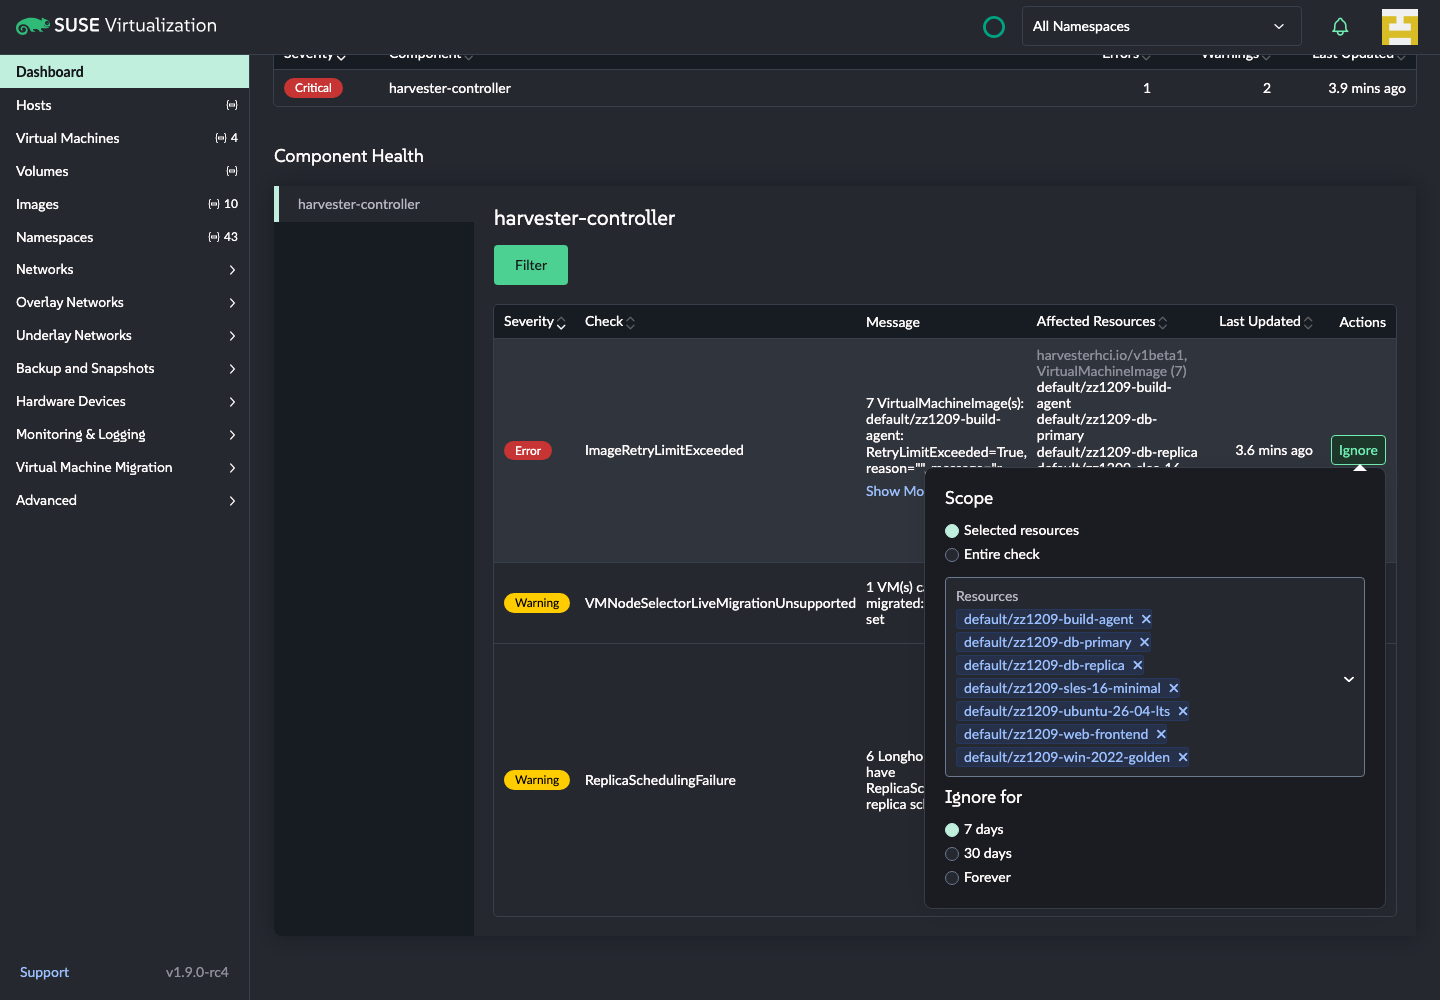
Ignore and Reason are hidden below the popup fold from 2 resources up
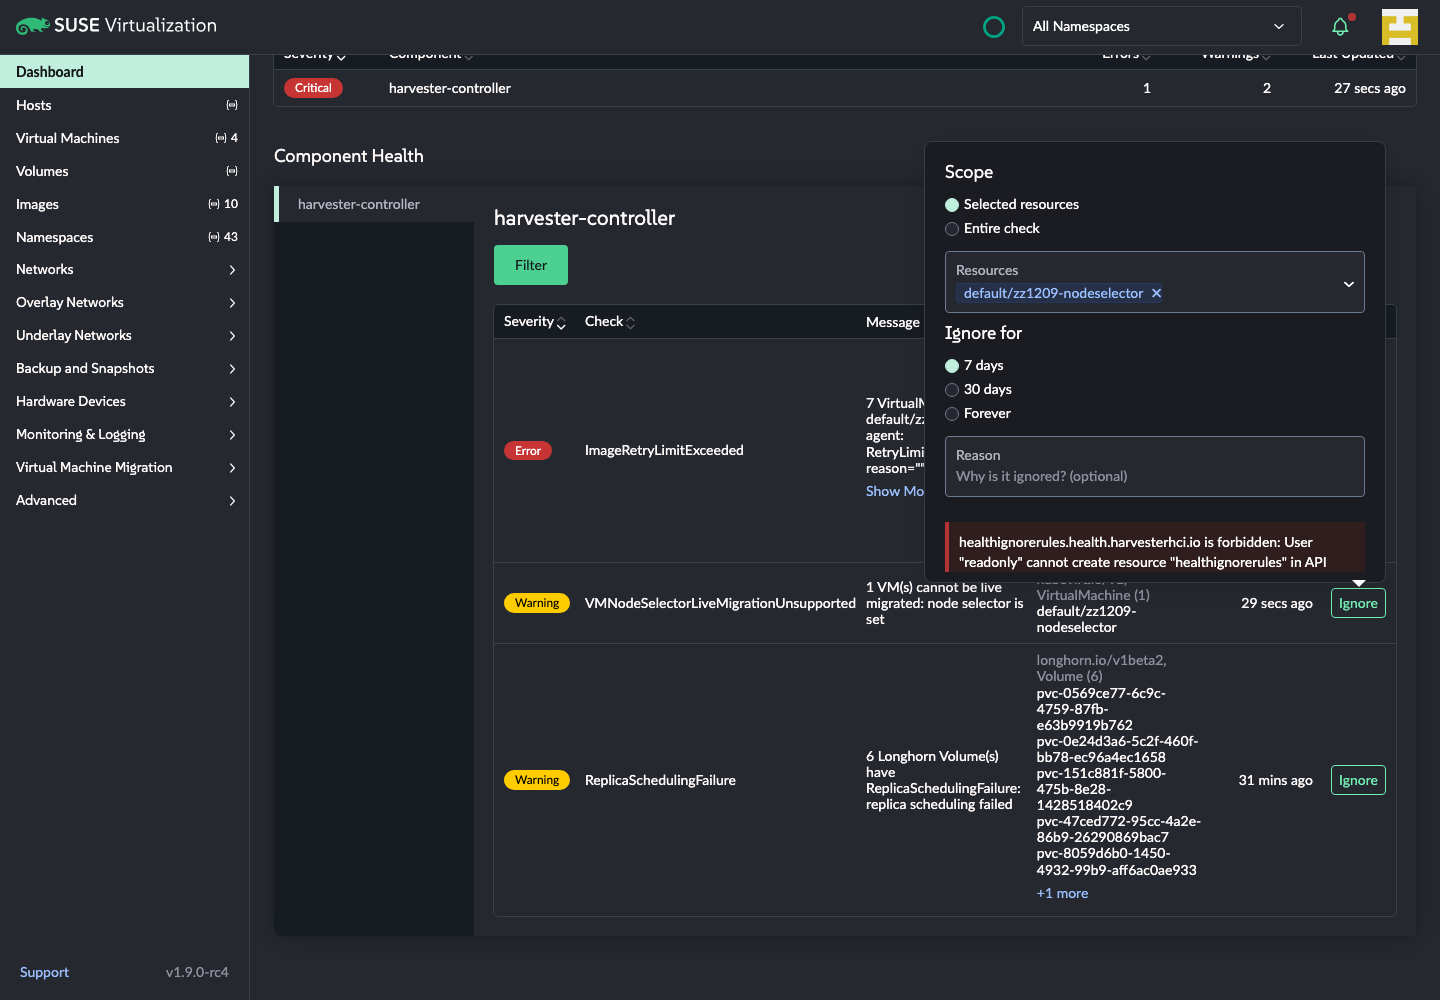
max-height: 420px applies even when the screen has room. The content is 405px with one resource, plus 23px per extra chip, so 2 resources already clip it. At 7 it is 543px, and the submit button and Reason are out of sight with no visible hint to scroll. Errors land there too: a failed save put the banner partly below the fold, so it can look like nothing happened. The window was 1000px tall in these shots.
7 resources: no Reason field and no Ignore button in viewFailed save (stubbed 403): the error is cut off by the fold
Suggested comment
From 2 resources the Ignore button and Reason are below the fold of the popup, with nothing showing that it scrolls, and a save error lands there as well. Could the 420px limit go, or apply only to the resources list so the button stays visible?
5
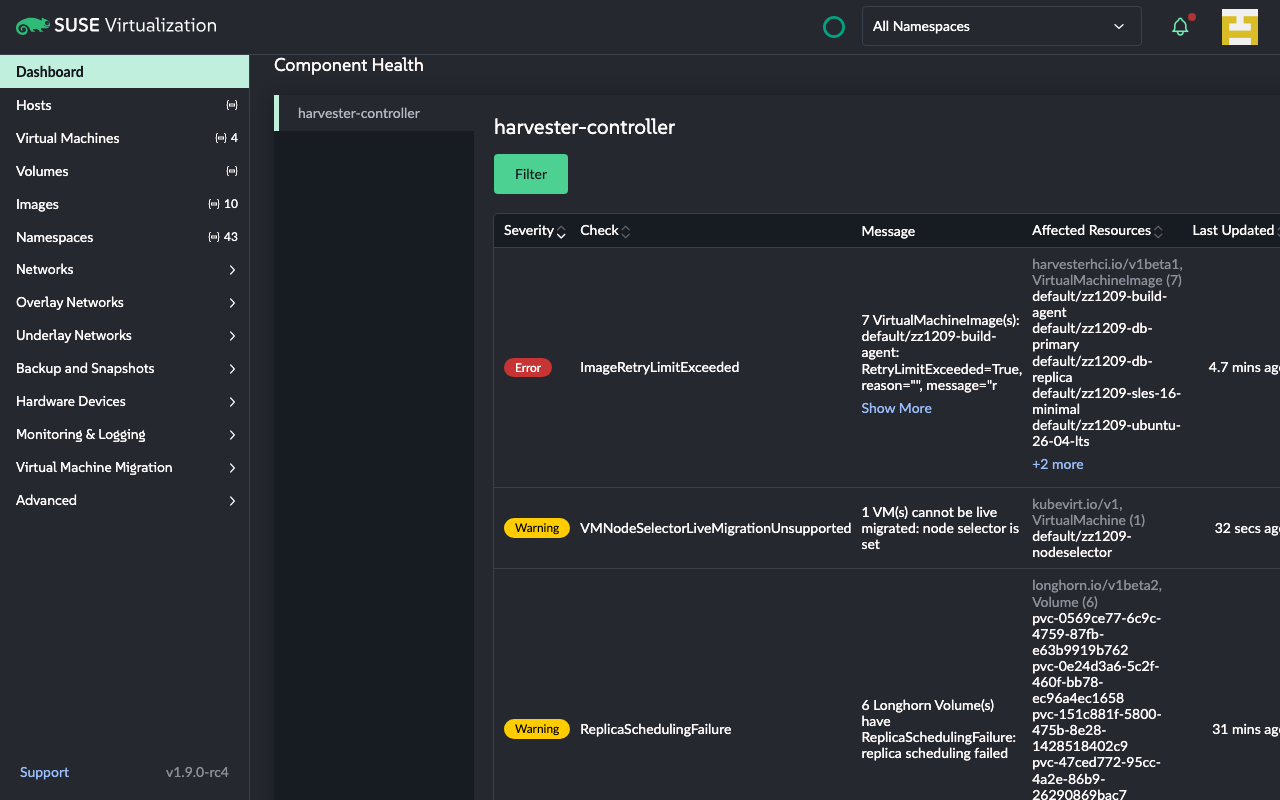
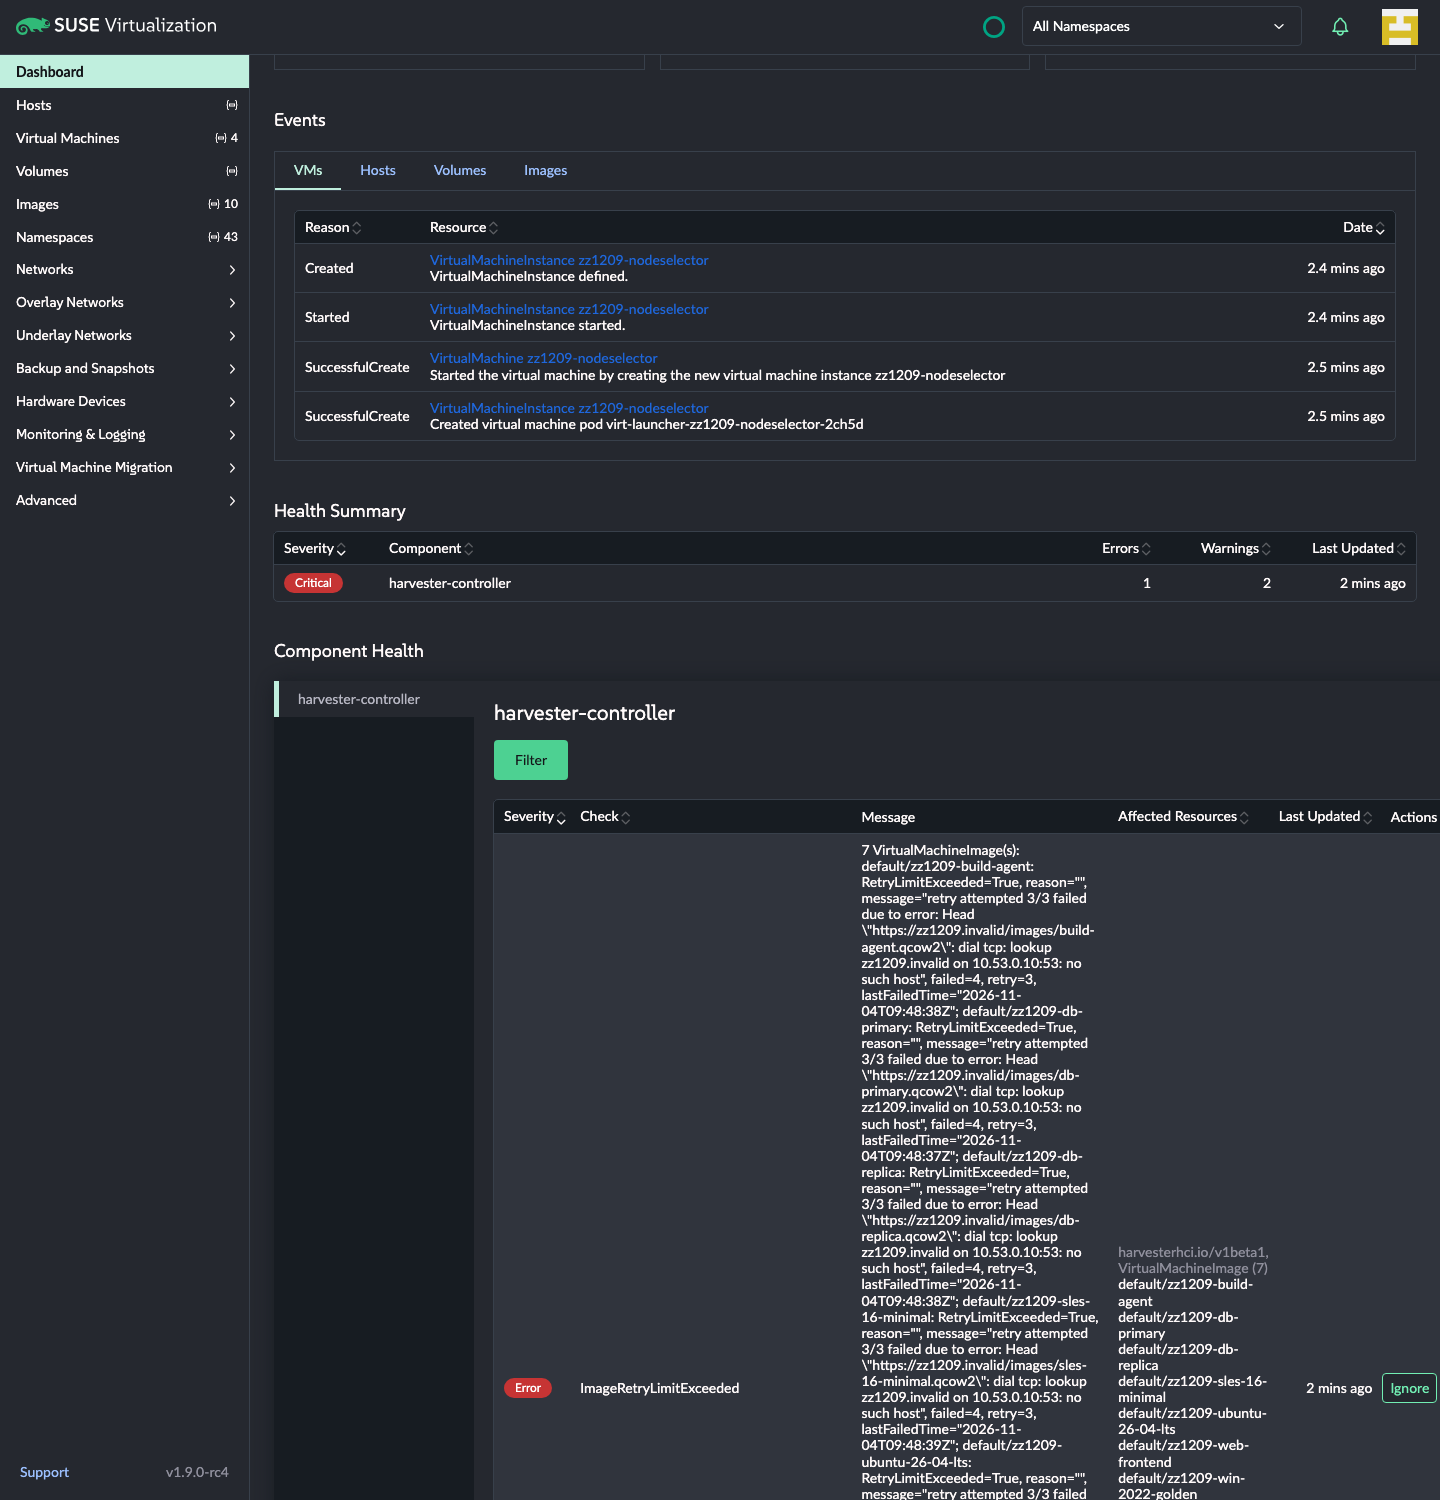
The table overflows below about 1405px, and at 1280 the Ignore button is off-screen
VMNodeSelectorLiveMigrationUnsupported cannot wrap, so Check takes 281px. Add the side tabs and the table needs more room than the section has. Measured: fine at 1405, 15px of page scroll at 1366, and at 1280 the Ignore button sits at x=1296–1351, entirely off-screen, so the whole page has to scroll sideways. Expanding a message overflows even at 1440 (table right edge 1447, section 1416). Finding 14 would solve this too.
1280px wide: Last Updated cut off, Actions gone
Suggested comment
On a 1280px screen the table is wider than the section, so Actions is off-screen and the whole page scrolls sideways. The long check names are the main cause, because they can't wrap. Could they break, or the side tabs go away?
6
Ignore and Restore stay enabled without permission (Copilot's two notes, still open)
Copilot raised this on 10-28 as "previously missed", and the diff still has no canCreate or canDelete check at dc84fe7. Tested with stubbed 403s only, not a real read-only user: Ignore shows the half-hidden banner from finding 4, and Restore shows a red growl. So nothing breaks, but the user finds out only after filling in the form.
Suggested comment
Copilot's note about permissions still applies: a user who can't create or delete rules still gets active Ignore and Restore buttons, and only finds out when the request fails. Could they check the rule schema and the rule's canDelete?
Message is the narrowest text column, at 171px. With 7 images the expanded text pushes the row to 1109px, more than a full screen. The text itself comes from the backend and is mostly repeated (see FYI), so a capped scroll area or a wider column would help more than the toggle.
Expanded message: 7 images, 1109px tall row, table past the section edge
Ignoring 1 of 7 says "The check ImageRetryLimitExceeded is ignored". Restoring one resource says "The check is restored". Both are visible in the clips above.
Suggested comment
Ignoring 1 of 7 resources says the check is ignored, and restoring one resource says the check is restored. Could these name the resources when the action is partial?
The controller keeps affectedCount as a raw fact by design, but the UI prints it next to the list. With 1 ignored and Show ignored off, the header says 7 and nothing explains the gap. The message also still leads with the ignored image. Something like "6 of 7" would be clear.
The popup asks for a reason and a duration, but after saving neither appears, even with Show ignored on. To find out why something is ignored or when it comes back, you need kubectl get healthignorerules. A tooltip on "Ignored" would be enough.
Show ignored on: "known bad mirror" and the 30 days are nowhere
11
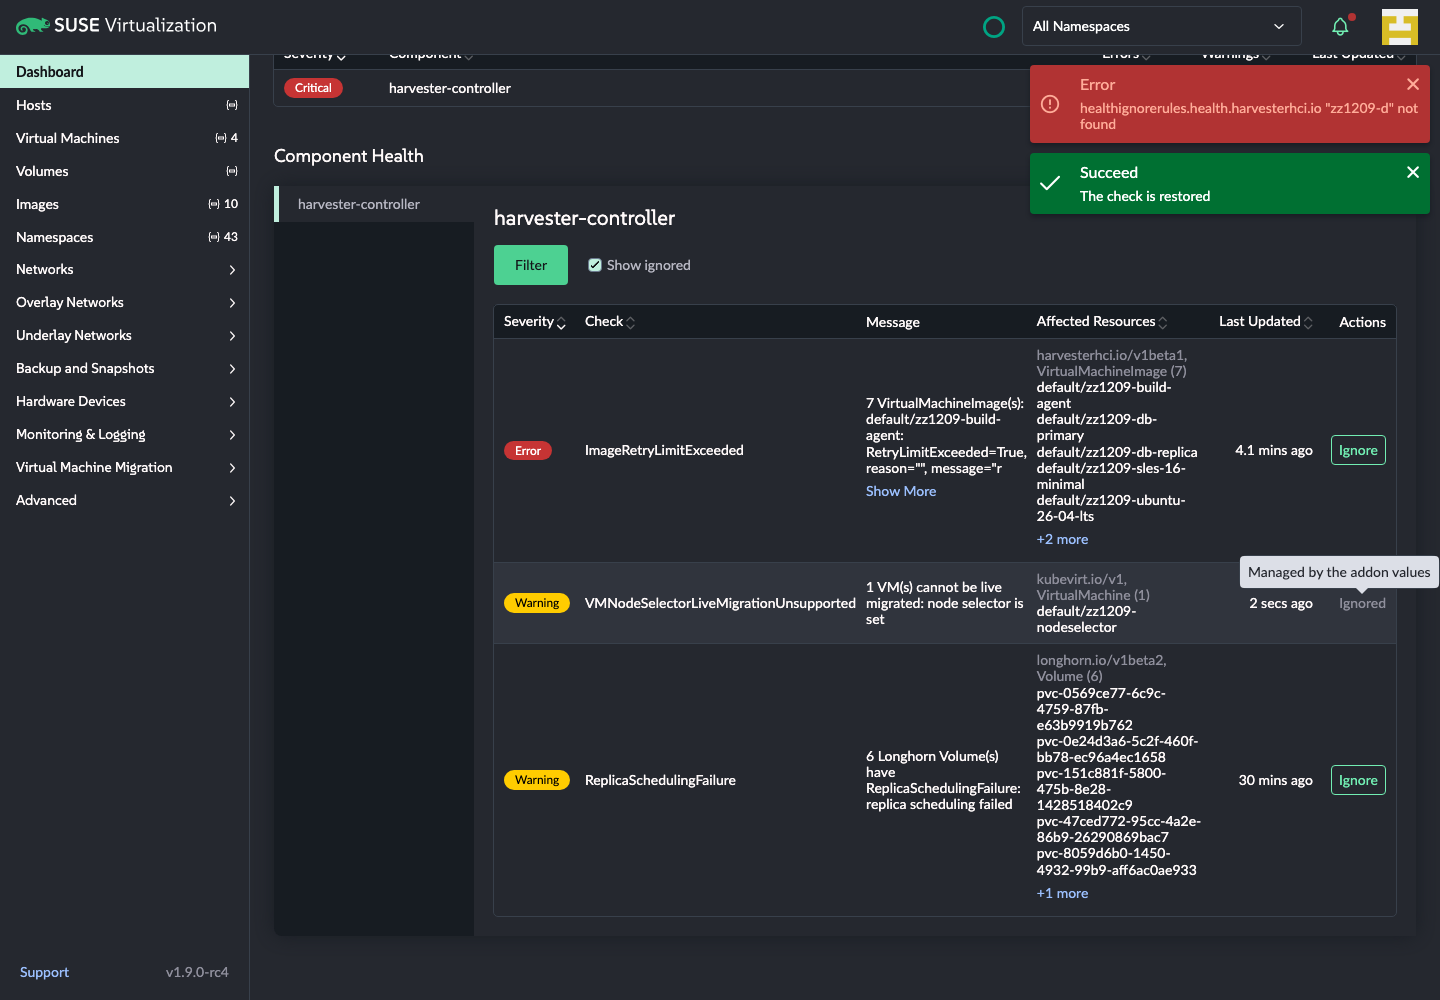
After Restore, the cell wrongly says "Managed by the addon values"
Once the rule leaves the store, canRestore is false but the check is still marked ignored until the controller reconciles. So the row falls through to plain "Ignored" with the addon tooltip. It lasted at least 4.5s in my probe. It corrects itself, but it says something untrue at the moment the user is looking.
Just after Restore: "Ignored" under a green "restored" growl
With Error unchecked, the Summary says Critical, the table shows no Error row, and the button looks exactly as it does unfiltered. Shown at the end of the walkthrough clip. A count on the button would fix it.
HEP story 1: "I can click through to see which resource is affected". The Events table just above links the same VM. The mockups do show plain text, so this may be planned for later.
14
Should this be one table instead of tabs per controller?
votdev asked on issue 8436 (10-19): end users don't know what each controller is, so use a table with component as a column, plus filters. It has no answer there. On real data every check belongs to harvester-controller, so today the tabs hold one entry, the Summary has one row, and the tab column costs the width that causes finding 5. The multi-tab layout works, but I could only see it with CRs I made up. Raw values like harvesterhci.io/v1beta1, VirtualMachineImage belong to the same audience question.
Synthetic data: extra components I created to test tabs, Node column and paging
Suggested comment
votdev's question on the issue about a single table with component as a column still looks open. With one real component today, the tab and the Summary row add little and take width from the table. What is the plan here?
15
Critical or Error? And what do the numbers count?
pkg/harvester/utils/component-health.js:37
Question
The Summary says Critical for what the detail calls Error. Errors also counts checks, not resources: 7 failed images read as "Errors 1". Both match the HEP, so these are product decisions, not bugs.
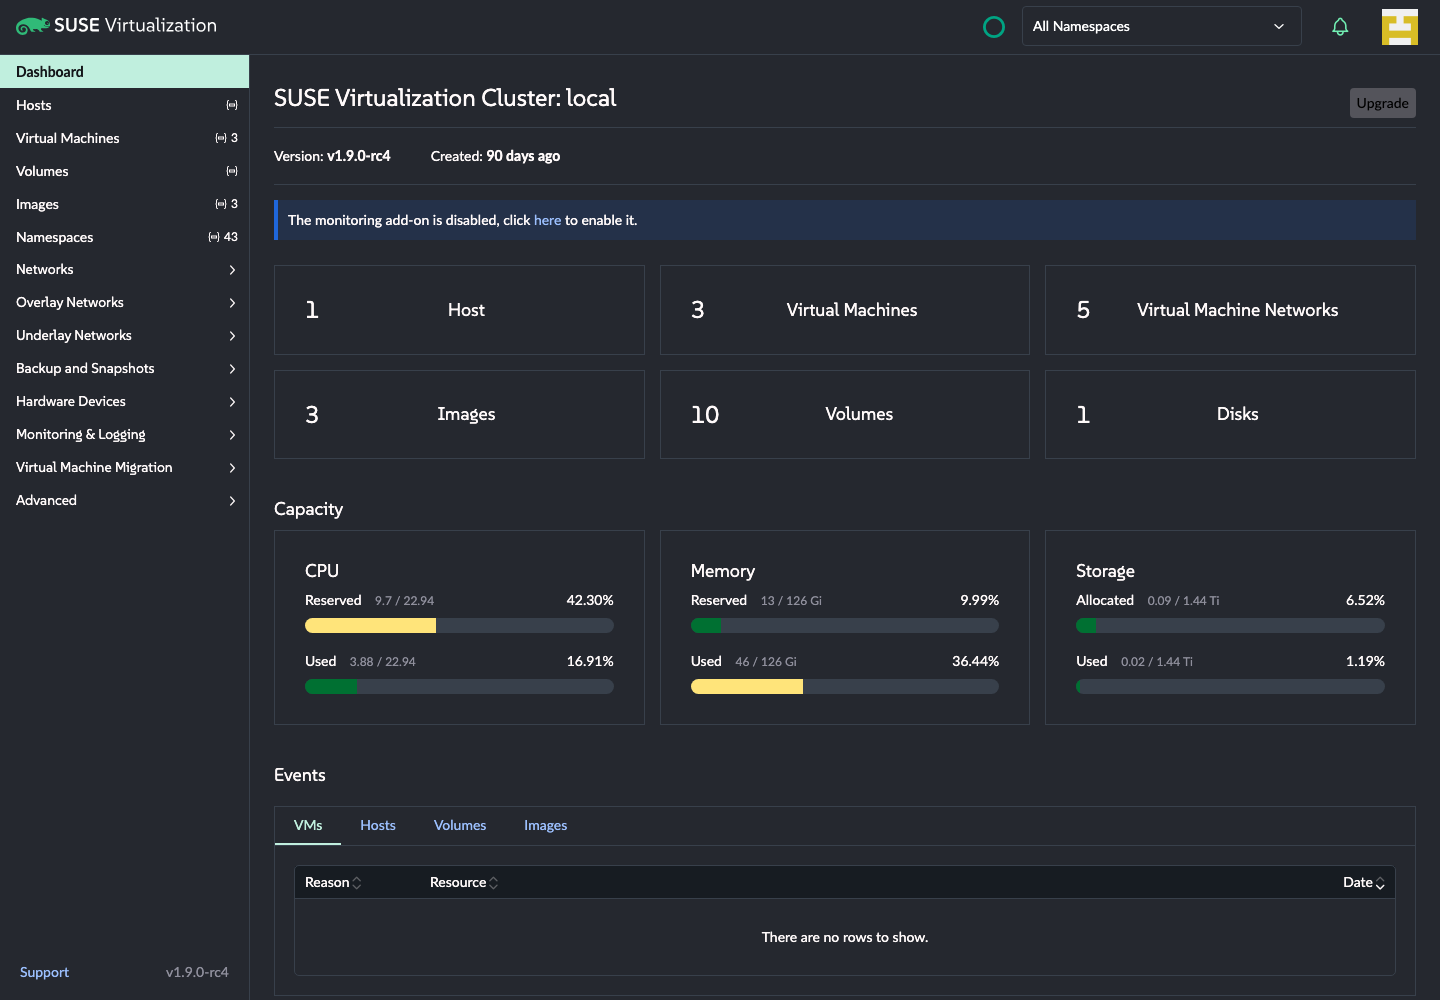
It matches the mockup. But HEP story 1 says "I open the dashboard and immediately see" the error, and at 1440×900 you must scroll past Capacity and Events to find a Critical. No badge or banner at the top points to it.
The sections start below Events
17
With the addon off (the default): a console error every visit and no hint
The sections hide correctly on v1.10 without the addon, and the page looks normal. But each visit logs Failed fetching… Unknown schema twice, because findAll runs without checking the schema. And nothing tells users the feature exists, while the monitoring addon on the same page gets a "click here to enable" banner.
Addon off: the page is unaffected, apart from the console
Suggested comment
Without the addon, which is the default, every dashboard visit logs two errors, because the components call findAll without checking the schema exists. Could they check first? Also, do we want a hint that the addon exists, like monitoring has?
Dead branch:min-severity and its string don't appear anywhere in the controller repo. Also, the chart ships no source=default rules yet. That branch works when simulated.
Double-click Restore: sends 2 DELETEs, then a red "not found" next to the green success.
Show ignored sticks: restoring the last rule hides the checkbox but leaves it on, so the next ignored check stays on screen.
Focus: Esc closes both popups but focus falls to body rather than the button that opened them.
Tests: nothing covers IgnoreCheckDropdown or Restore, which is where the bugs above are.
PR description: Summary and the screenshot section are empty.
Double-click on Restore
FYI: backend, not this PR
Shipping: charts PR 639, addon PR 12056 and the HEP are all still open. The chart defaults to rancher/harvester-resource-health-controller:main-head, but Docker Hub lists no tags for that repo.
Summary goes stale on delete:onComponentHealthChanged returns early on a nil object, so deleting a ComponentHealth doesn't recompute the summary until the next change. Seen with my synthetic CRs.
Messages: they are raw and repetitive (RetryLimitExceeded=True, reason="", message="…" once per image, 2113 characters for 7 images). Cleaning them up would do more than any UI truncation.
What was checked
Case
Result
Notes
Case 1: VM with a node selector
Pass
Real fixture, VMNodeSelectorLiveMigrationUnsupported Warning.
Case 2: not enough volume replicas
Pass
No fixture needed: this one-node box already reports ReplicaSchedulingFailure on 6 volumes.
Case 3: image with a bad URL
Pass
7 images. Warning while retrying, then Error ImageRetryLimitExceeded.
Case 5: support bundle
Pass
Info row appeared live after about 5s. Cleared in the controller at ready (about 3.4 min).
Case 8.1: ignore one resource
Findings 3, 8, 9
The resource leaves the list about 3s later, without a reload.
Case 8.2: ignore the entire check
Pass
Done on the VM check with Forever: no resources or expiresAt sent. Summary dropped from Critical to Warning when the Error check was fully ignored.
Case 8.3: expired rule
Pass
Check returned about 3s after setting a past expiresAt.
Cases 4, 6, 7
Not run
These need a full bucket or a guest cluster. They exercise the controller, and render through the same table.
Severity sort, both tables
Pass
Error, Warning, Info. Copilot's fix holds.
Show More and +N more
Pass
Copilot's fix holds. Real buttons, reachable by keyboard.
Filter counts and empty message
Pass
"No checks match" versus "No issues detected" are told apart correctly.
Simulated by labelling a rule source=default: "Ignored" with no Restore.
Light theme
Pass
Tables and popup are fine. Body class swap only, nothing saved.
Unit tests and page errors
Pass
The PR's 5 tests pass, CI is green, no uncaught page errors in any run.
Real read-only user
Not tested
Only stubbed 403s. I didn't create a user on .118.
Inside Rancher (extension mode)
Not tested
Standalone preview only.
Real v1.10 backend
Not tested
.118 is v1.9.0-rc4 with the version forced in the build, and the controller is the author's dev-18 image.
Suggested review (Request changes, inline comments as drafted above)
I tested this on a real Harvester with the resource health controller (dev-18), plus failing images and a VM with a node selector. Reading the data works well and live updates are quick. The problems are mostly in Ignore and Restore, details inline.